Actuarial cash flow models play a key role in financial and insurance analysis. They help actuaries estimate future cash movements based on policyholder behaviour, economic conditions, and various assumptions. Understanding these models is essential for pricing, reserving, and risk management. In this post, we will explore how such models work and how you can build one in Python using the cashflower package.
Overview of actuarial cash flow model
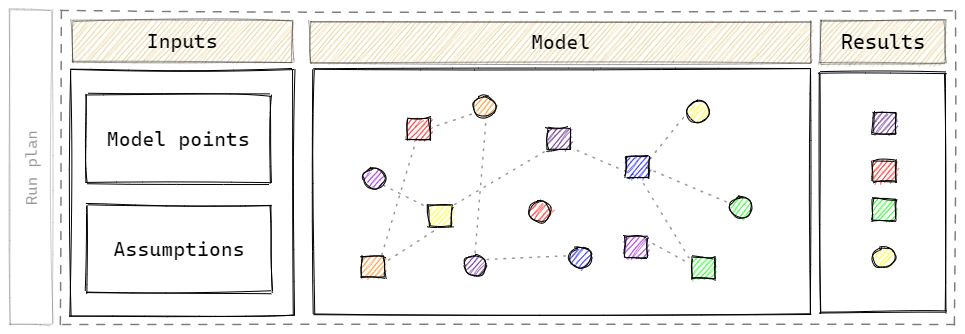
Run plan - run plan is a list of runs that we want to perform with the model. Actuaries need results for the model under various assumptions. For example, the first run has base assumptions, the second shocked mortality and the third shocked lapses. Each of these runs requires a separate version. The run plan includes the list of versions and corresponding model configuration.
Model points - model points are points of data for which the model is calculated. One model point can represent, for example, a policyholder or a financial asset. Model points contain attributes of an object they represent. In case of a policyholder, they can contain attributes such as age, sex, premiums, coverage, etc.
Model point set contains all model points to be evaluated. Model point sets can be split into separate files. For example, there might be separate files for fund and coverage data.
Assumptions - actuarial cash flow models base on assumptions and parameters.
Assumptions are the data that we predict that will happen in the future. For example, underwriting assumptions include mortality, lapses or expenses. Market assumptions include interest rates and inflation curves.
Parameters are data used by model which are certain. Examples of parameters are characteristics of insurance products, such as such as fees or levels of guarantees.
Model - actuarial model reminds a spider’s web or - if you are a food lover - a spaghetti. There are many variables which dependent on each other. Some of these variables read data from model points and assumptions.
Model variables - variables are defined by functions that depend on the projection’s period.
Results - the data that we want to get out of the model. The output's settings should imply which variables from the model we want to have in the output. Other important aspects of the results are:
- aggregation of results - do we want to have output per policy, per some groups or for the whole portfolio,
- periods - how many months or years should results have.
We have presented the main components of the actuarial cash flow model. There is much more to it but knowing these components is a nice first step toward actuarial cash flow models.
Modelling cash flows
Actual vs expected cash flows
In actuarial cash flow models, we are modelling expected cash flows as opposed to actual cash flows. What does it mean? Let's explain it with an example of 5-year term life insurance.
Actual cash flows
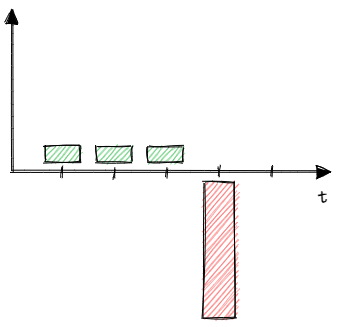
In reality, the policyholder may die in the fourth year. The policyholder will pay premiums to the insurance company for three years and then the insurance company will pay the sum assured to the policyholder in the fourth year. The actual cash flows will look like this:
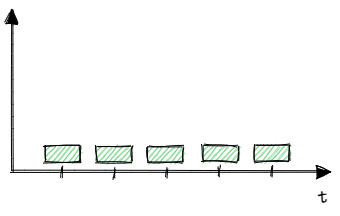
Or the policyholder may not die at all in the 5-year term. Then the policyholder pays the premiums to the insurance company during the whole term and the insurance company does not pay anything to the policyholder.
Expected cash flows
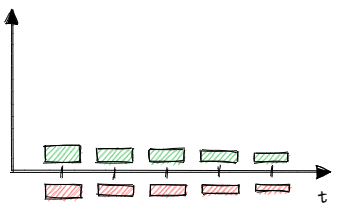
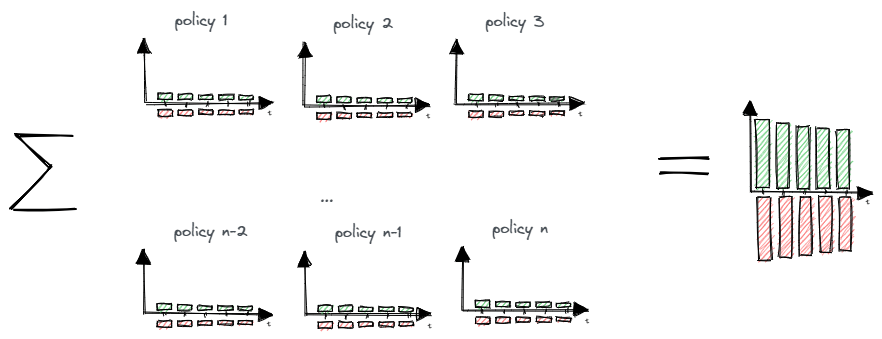
We do not know which of the scenarios will realise in reality. So - instead - we model expected cash flows. We assume a certain mortality rate for the policyholder. We multiply the premium by the probability that the policyholder survives up to the given year. We multiply the sum assured by the probability that the policyholder will die in the given year. The expected cash flows will look like that:
Pooling
Our expected cash flows look very different from the actual ones. Is our model correct?!
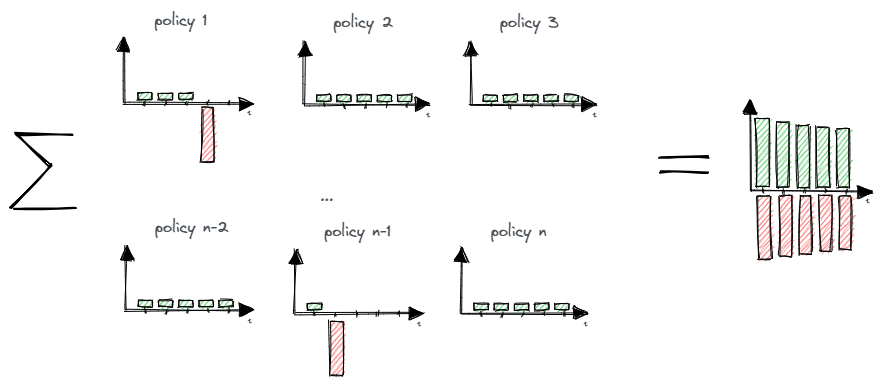
In the case of a single policy, the actual and expected cash flows differ materially. However, the insurance company has a portfolio of many policies (e.g. few thousand policies).
If we sum up actual cash flows and expected cash flows for all policyholders, they should be close to each other. In reality, some policyholders will die within the 5- year term and many will not. After aggregation, they should be close to the expectations.
Actual cash flows
Expected cash flows
Thank you for taking the time to read this blog post! I hope you found it helpful and informative. If you have any thoughts or questions, please feel free to leave a comment below or on github. Your feedback is valuable to us!

