Model points are essential inputs in an actuarial cash flow model. They represent individual objects - such as insurance policies or financial assets - for which cash flows are projected. Understanding model points is crucial for structuring actuarial models efficiently.
In this post, we will explain what model points are, their role in modelling, and how to set them up properly.
What are model points?
In short, a model point represents an object for which the actuarial cash flow model will be evaluated.
If you model life insurance, model points may be policy data which contain information on policyholders (age, sum insured, fund value etc.). If you model assets, model points can include characteristics of financial assets such as bonds.
In the past, it was common to group multiple objects (e.g. multiple policyholders) with similar characteristics into one model point. Thanks to that, the model could run faster. Nowadays, it's not so common, because grouping requires additional work and computers just got faster.
In Python framework for actuarial cash flow models cashflower, the following naming convention is used:
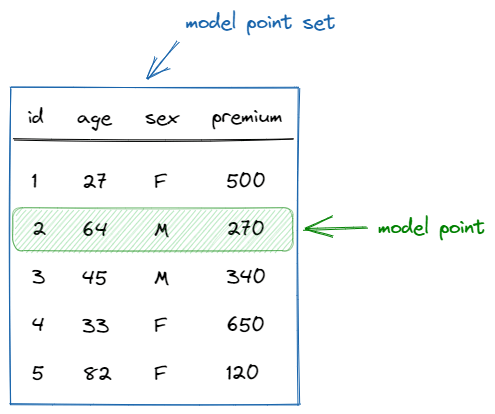
- model point set - a group of model points; it can have a form of a file or a database query result,
- model point - one or multiple records that contain data on the given object (e.g. a policyholder or a financial asset),
- record - a single row of data.
In the example below, there are 5 policyholders. The policyholder with the identifier 2 is a 64-year old male who pays €270 premium.

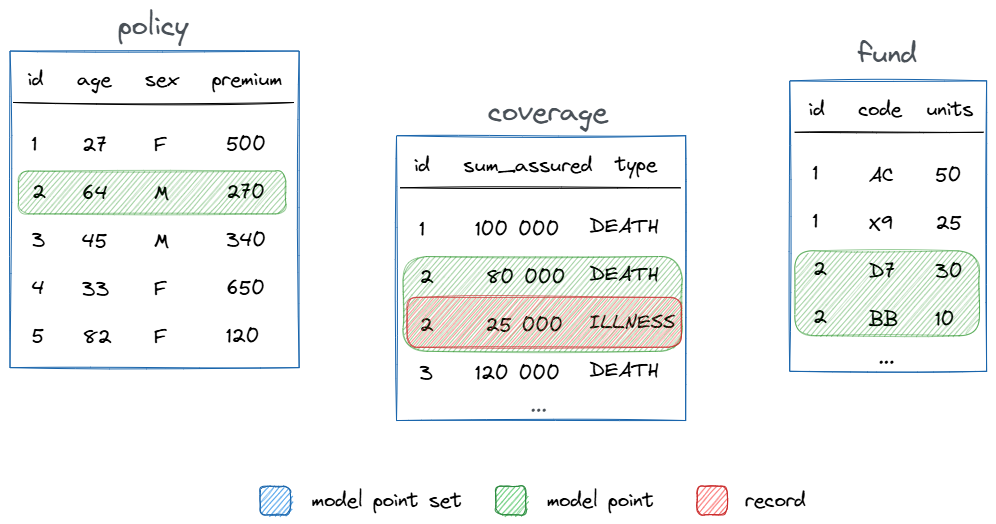
A cash flow model can have multiple model point sets.

The above model has 3 model point sets: policy, coverage and fund. The model point for the identifier 2 has 5 records (1 in policy, 2 in coverage and 2 in fund).
Working with model points
Cheatsheet for working with model points in the cashflower package.
Define model point set
Model point sets are defined in the input.py script. To create a model point set, use the ModelPointSet class and provide a pandas data frame as an argument for the data parameter.
# input.py
from cashflower import ModelPointSet

policy = ModelPointSet(data=pd.DataFrame({
    "id": [1, 2, 3, 4, 5],
    "age": [27, 64, 45, 33, 82]
    "sex": ["F", "M", "M", "F", "F"],
    "premium": [500, 270, 340, 650, 120],
}), main=True, id_column="id")

coverage = ModelPointSet(data=pd.DataFrame({
    "id": [1, 2, 2, 3, 4, 5, 5],
    "sum_assured": [100_000, 80_000, 25_000, 120_000, 30_000, 120_000, 10_0000],
    "type": ["DEATH", "DEATH", "ILLNESS", "DEATH", "DEATH", "DEATH", "ILLNESS"],
}), main=False, id_column="id")

fund = ModelPointSet(data=pd.DataFrame({
    "id": [1, 1, 2, 2, 3, 4, 5],
    "code": ["AC", "X9", "D7", "BB", "EF", "T6", "ZE"],
    "units": [50, 25, 30, 10, 40, 100, 15],
}), main=False, id_column="id")
The policy model point set is the main model point set, which means that the model will loop over the rows of this dataset. Model point sets match with each other based on the id column.
Read data from model point
To read a value from a model point, use the get() method of the ModelPointSet class. Provide a name of the attribute as an argument.
policy.get("age")The model will read the value of the model point which is currently calculated.
# model.py
from cashflower import variable
from input import assumption, policy

@variable()
def mortality_rate(t):
    age = policy.get("age")
    sex = policy.get("sex")
    return assumption["mortality"].loc[age, sex]["rate"]
If the model point has multiple records, you can read them like this:
fund.get("fund_value", record_num=1)This code will get the value of fund_value for the second record of the currently evaluated model point (counting starts with 0 in Python!).
If model points have varying number of records, you can use e.g. fund.model_point_data.shape[0] to determine the number of records of the model point.
For example, to calculate the total value of fund value, use:
# model.py
@variable()
def total_fund_value(t):
    total_value = 0
    for i in range(0, fund.model_point_data.shape[0]):
        total_value += fund.get("fund_value", i)
    return total_value
Thank you for taking the time to read this blog post. If you have any comments or suggestions, please feel free to share them in the comment section below or on github.

